 KitCut
Where LLM leaderboard scores come from: we traced 3,778 of them
llm-stats.com and benchlm.ai are two widely used LLM leaderboards, with about 1.2 million visits each in September 2026 by Similarweb's estimates. Both rank models on benchmark scores. We traced 3,778 of those scores to where they came from, and neither site ran any of the tests behind them. On llm-stats.com, 1,213 of the 1,222 results on its 15 major benchmark pages (99.3%) are the labs' own published numbers, and none is marked verified by the site. On benchlm.ai's top 60 model pages, 42% of the scores come from the labs, which it says it keeps out of its ranking, and 46% from independent evaluators. Both link every number to its source, which is what made this count possible.
Updated 25 October 2026. Every count below is a snapshot of that day.
Key findings
- Neither site ran the tests behind its ranking. Both collect numbers that others published, link each one to its source and combine them into one score.
- llm-stats.com: 1,213 of 1,222 results on its 15 major benchmark pages are flagged self-reported, meaning the model's maker published them. None of the 1,222 is marked verified.
- benchlm.ai: of 2,556 scores on its top 60 model pages, 41.7% come from the model makers, 45.9% from independent evaluators (Artificial Analysis alone 30.8%) and 12.4% from niche benchmark sites. It says the makers' own numbers are shown but kept out of its ranking. 137 of its 224 ranked positions are estimated statistically.
- The setting is part of the score. ARC Prize ran GPT-6 Astra on ARC-AGI-3 with two different harnesses and measured 99.9%, matching OpenAI's own figure, and 62.7%. llm-stats.com shows OpenAI's 99.9%; benchlm.ai shows ARC Prize's 62.7%.
- One benchmark name can hold different tests. In the pages we compared, 86 model-benchmark pairs appear on both sites. 10 differ, because the two sites filed different variants of a result under the same name.
- New models arrive late, and new image models not at all. Of 26 language models released in the 30 days to 25 October, llm-stats.com lists 46% and benchlm.ai 58%. Of 5 new image and video models, neither lists any.
Which LLM leaderboard should you use?
It depends on what you want to know. Some leaderboards run the tests themselves, one counts people's votes, and some collect the numbers that others publish. Here are seven, each checked on its own pages on 25 October 2026:
| Site | Ranks on | Who runs the tests | When to use it |
|---|---|---|---|
| LMArena (now Arena) | Which of two answers people prefer | Human votes, blind | For what people prefer in chat, code, images |
| Artificial Analysis | An index of 10 tests, cost per task, speed | Its own runs | To compare labs on one setup |
| Epoch AI | Its index of over 50 tests | Its own runs, plus others' | For hard maths and science |
| Vals AI | Finance, law, tax, health, coding | Its own runs, many on private sets | For legal, finance or tax work |
| ARC Prize | ARC-AGI tasks, against cost per task | Its own runs, on a semi-private set | For how models cope with new tasks |
| llm-stats.com | One overall score, speed and price | Numbers gathered, almost all from labs | To find a lab's own number fast |
| benchlm.ai | One score with a 90% interval | Numbers gathered; labs' own kept out of the rank | For a ranking that shows how sure it is |
The last two gather numbers that others produced and link each one to its source. We traced 3,778 of them, so that when you read a score on either site you know whose number you are reading.
Where do LLM leaderboard scores come from?
A benchmark score exists because somebody ran a test. That somebody can be one of three:
- The lab that made the model. It runs the test on its own model and publishes the result in a system card, a launch post, a paper or a model card. Leaderboards call this self-reported.
- An independent evaluator. Groups such as ARC Prize, Artificial Analysis, Epoch AI and Vals AI run tests themselves and publish the results on their own pages.
- The leaderboard itself. A site can run one fixed test on every model it ranks.
llm-stats.com and benchlm.ai work from the first two. They watch for new models, find each model's numbers, match the many spellings and effort levels one model goes by, put each benchmark on one scale and combine the results into one score. That is real work, and it is most of what these sites do. What neither does is run the tests.
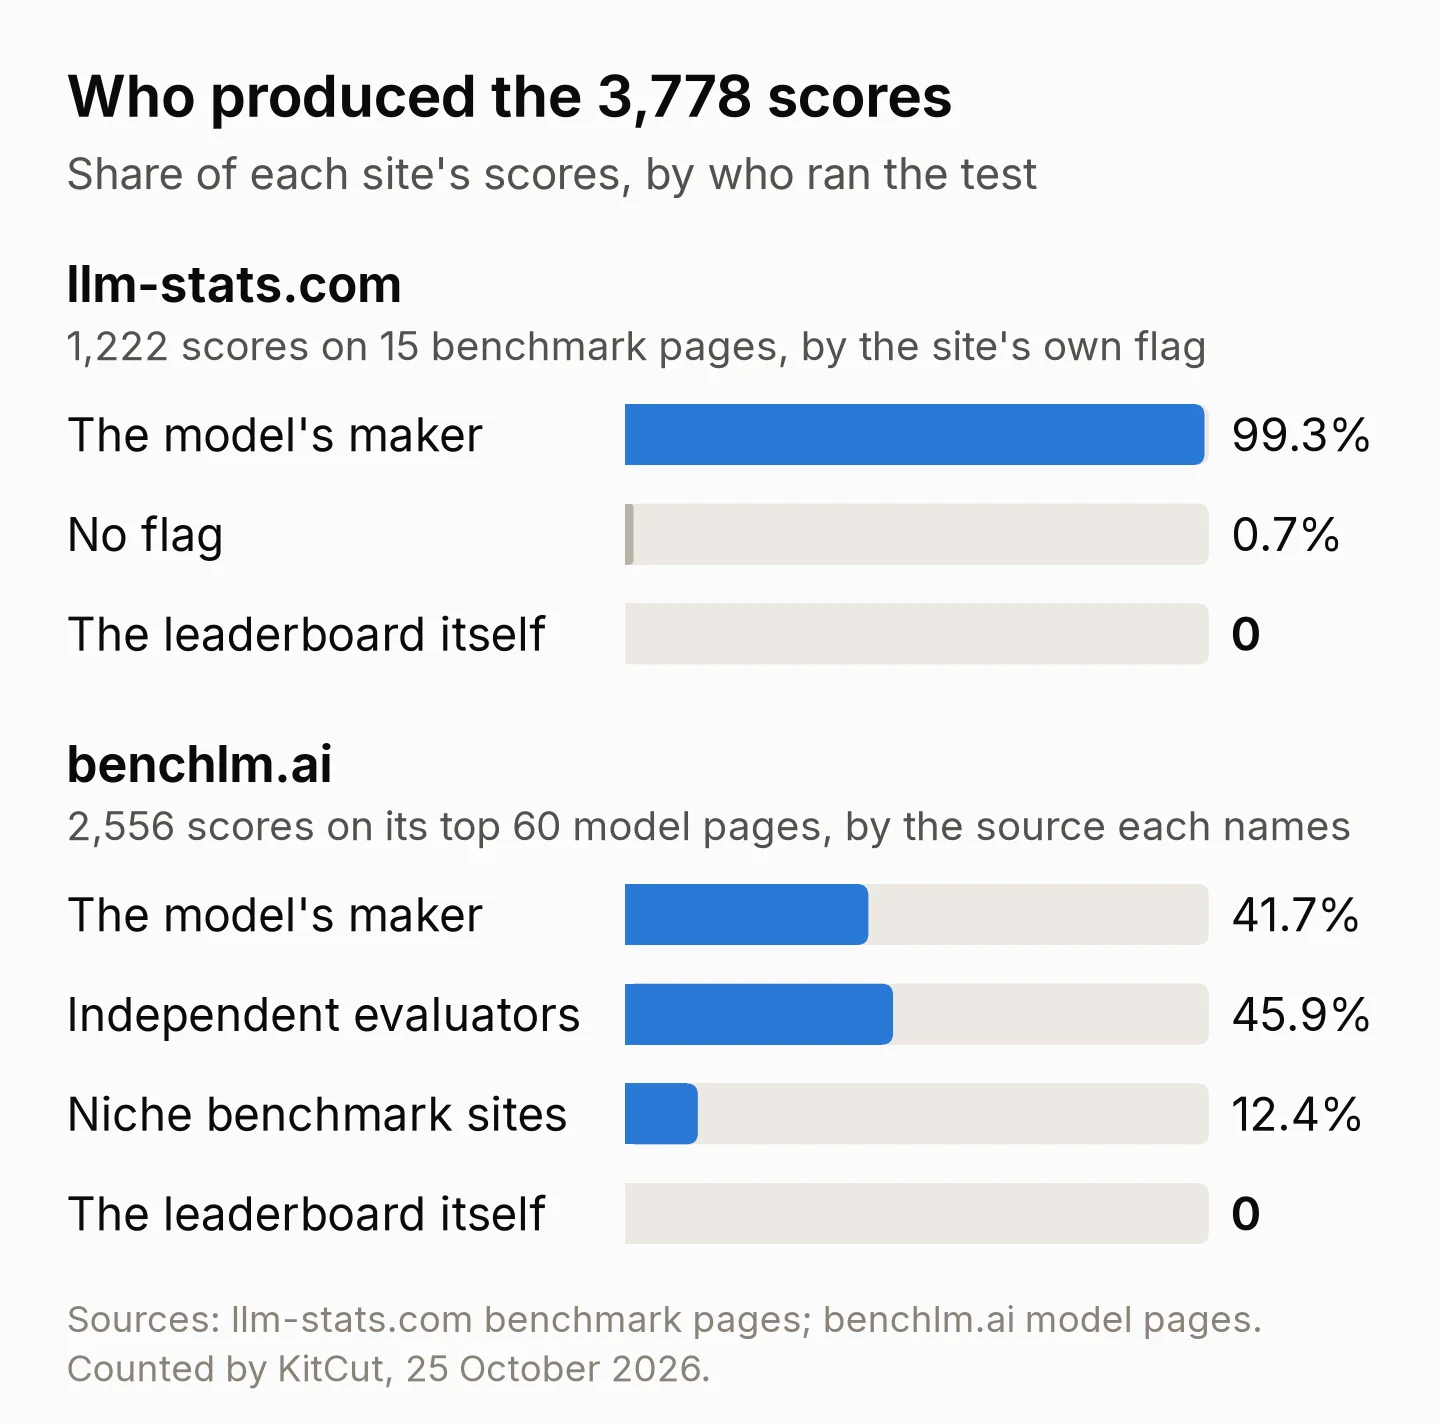
| Who produced the score | llm-stats.com | benchlm.ai |
|---|---|---|
| Scores counted | 1,222 on 15 benchmark pages | 2,556 on the top 60 model pages |
| How we classified | the site's own self-reported flag | the source each row names |
| The lab that made the model | 1,213 (99.3%) | 1,065 (41.7%) |
| Independent evaluators | not flagged separately | 1,173 (45.9%) |
| Niche benchmark sites | not flagged separately | 318 (12.4%) |
| No flag either way | 9 (0.7%) | every row names a source |
| The leaderboard itself | 0 | 0 |
Where do llm-stats.com's scores come from?
llm-stats.com is run by ZeroEval Inc., a 2025 Y Combinator company. "We're two people," says its About page. The site is broad: its sitemaps list 584 model pages and 761 benchmark pages. Each benchmark page carries its own counters (how many results it holds, how many are verified and how many are self-reported), so counting means reading them. GPQA's page, for example, holds 256 results: 0 verified, 253 self-reported.
Across 15 major benchmarks the counters add up to 1,222 results. 1,213 are flagged self-reported. 9 carry neither flag. None is marked verified.
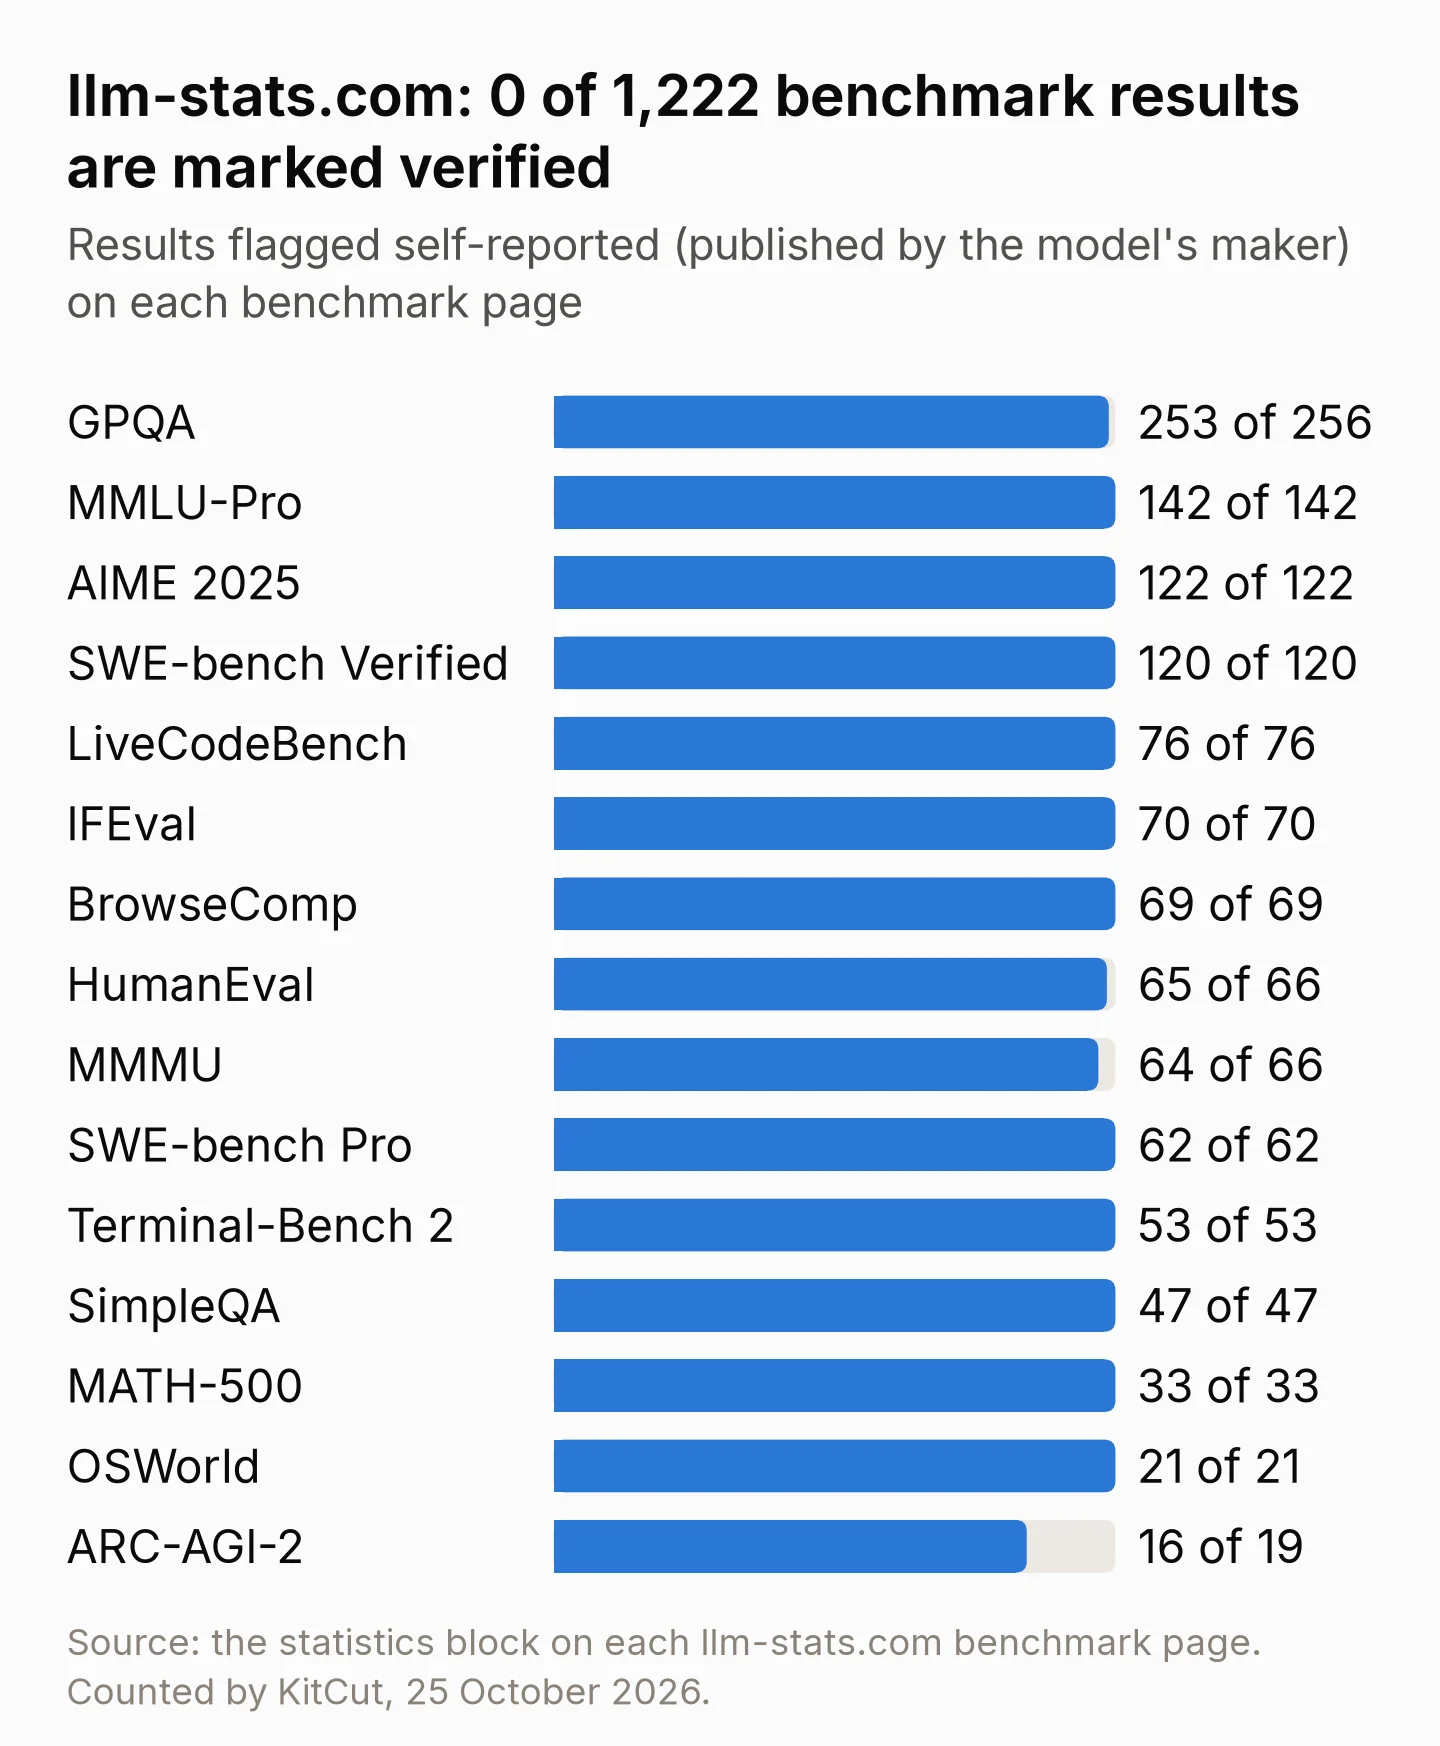
| Benchmark | Self-reported | No flag | Verified |
|---|---|---|---|
| GPQA | 253 of 256 | 3 | 0 |
| MMLU-Pro | 142 of 142 | 0 | 0 |
| AIME 2025 | 122 of 122 | 0 | 0 |
| SWE-bench Verified | 120 of 120 | 0 | 0 |
| LiveCodeBench | 76 of 76 | 0 | 0 |
| IFEval | 70 of 70 | 0 | 0 |
| BrowseComp | 69 of 69 | 0 | 0 |
| HumanEval | 65 of 66 | 1 | 0 |
| MMMU | 64 of 66 | 2 | 0 |
| SWE-bench Pro | 62 of 62 | 0 | 0 |
| Terminal-Bench 2 | 53 of 53 | 0 | 0 |
| SimpleQA | 47 of 47 | 0 | 0 |
| MATH-500 | 33 of 33 | 0 | 0 |
| OSWorld | 21 of 21 | 0 | 0 |
| ARC-AGI-2 | 16 of 19 | 3 | 0 |
| All 15 | 1,213 of 1,222 (99.3%) | 9 | 0 |
The model pages tell the same story. On the pages of 16 models from the top of its leaderboard, 228 of 241 score rows are self-reported, 13 carry neither flag and none is verified. Most of them link to the makers' own pages: openai.com (58 rows), anthropic.com (55), deepmind.google and blog.google (39), huggingface.co (33), kimi.com (30) and z.ai (7). Each model page says so in words: "Scores sourced from the model's scorecard, paper, or official blog posts." The site's earlier open data on GitHub, marked deprecated since 24 October 2025, has 2,206 of its 2,224 rows self-reported and none verified by llm-stats.
What the site says about itself
Its developer page says "Scores are source-verified, not self-reported", and its methodology counts a benchmark release as verified if it is "lab-published or independently replicated". Neither wording means that anyone outside the lab ran the test, and in the site's own data a lab's number carries self_reported: true and verified: false.
What it measures itself
llm-stats.com does measure some things of its own. Model pages show time to first token, throughput and failed-request rate "from live model usage over the trailing 7 days", which is traffic through its own playground, app builder and API. The samples are small. Of 18 leaderboard models we fetched on 25 October, 14 had no requests in the window. Gemini 3.7 Flash had 59 and GPT-5.4 mini 2; Claude Opus 5.5 showed 10 in one fetch and 3, two of them failed, in a later one. Measuring speed on real traffic is a sound idea; at these volumes the numbers are thin. Its methodology page also says providers' published prices are "checked against observed billing data". And the site ran arenas, where people voted between two models' answers. New submissions have closed and the rankings stay up as an archive. The company also sells custom evaluations to clients; those are private and do not appear on the site.
Where do benchlm.ai's scores come from?
benchlm.ai is built and maintained by one person. Its About page says plainly what it is: it "gathers publicly reported evaluation results from provider model cards, benchmark leaderboards and papers into one ranking", and "BenchLM does not run private evaluations".
Every benchmark row on a benchlm.ai model page names its source, so counting means grouping those names. The pages of its 60 highest-ranked models hold 2,556 rows:
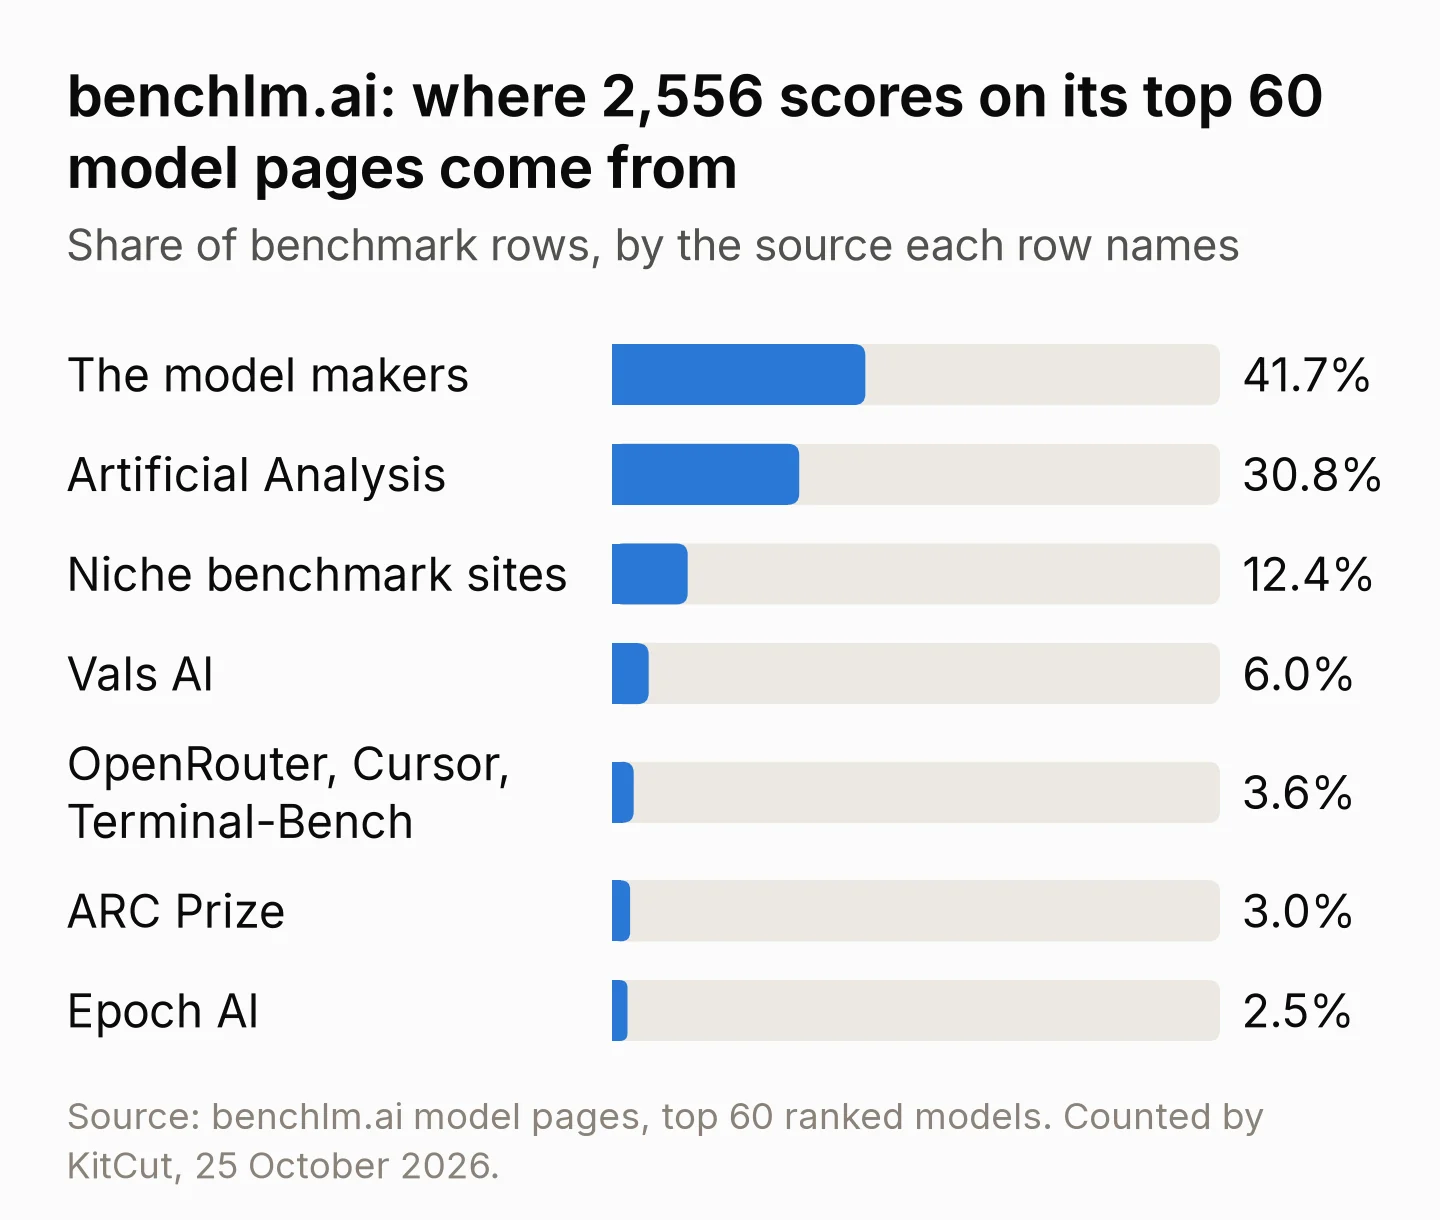
| Source named on the row | Rows | Share |
|---|---|---|
| The model makers (model cards, launch posts, papers, repositories) | 1,065 | 41.7% |
| Artificial Analysis | 787 | 30.8% |
| Niche benchmark sites | 318 | 12.4% |
| Vals AI | 154 | 6.0% |
| OpenRouter, Cursor, Terminal-Bench | 91 | 3.6% |
| ARC Prize | 76 | 3.0% |
| Epoch AI | 65 | 2.5% |
| All sources | 2,556 | 100% |
In what we counted, benchlm.ai leans on the labs far less than llm-stats.com does, and more on evaluators who ran the tests themselves. Artificial Analysis alone supplies almost a third of the rows. And by its own rule the labs' rows stay out of its ranking: its methodology says vendor-run numbers are shown and labelled but "kept out of the rank".
How its ranking fills the gaps
The ranking, BenchAlign v5.8, gives each model a score from 0 to 100 with a 90% interval. It starts from outside leaderboards, such as composite indices and human-preference rankings, and lets direct benchmark results move the score by at most 3 points. In all, 58 benchmarks in 8 categories carry weight (About page, methodology). Where the evidence behind a model is thin, benchlm.ai estimates its position: 137 of its 224 ranked models are marked Estimated and 87 Supported. An Estimated position "uses a learned blend of the model's own signals, its calibrated benchmark estimate, a reviewed lineage prior, the previous policy estimate, and eligible peers", and peers can carry at most 60% of the blend. The benchmark numbers themselves are left alone: "Missing tests remain blank; the estimator never adds benchmark values." The methodology also publishes where the estimator failed its own back-tests: "Three checks of 95th-percentile error still worsened." That is the kind of disclosure every ranking should carry.
What it tests itself
benchlm.ai has run one test of its own: an audit of seven API gateways (OpenRouter, DeepInfra, Together, Requesty, Fireworks, Groq and Cerebras), run on credits it bought itself, with "one identical workload": 900 requests on each of the five scored platforms and 450 on Groq and Cerebras. It measures the gateways, their cost, latency and reliability, rather than what the models can do. Its speed figures come from Artificial Analysis.
What does a self-reported benchmark score mean?
Self-reported means the lab that made the model ran the test and published the result. It does not mean the number is wrong, and on release day it is often the only number there is. It does mean the lab chose how the test was run: the harness (the code that hands the model the task and keeps track of its work), how much reasoning it was allowed, which tools it had and how many attempts counted. Those choices can move a score a long way.
GPT-6 Astra on ARC-AGI-3 shows how far. OpenAI's launch table gives 99.9%. That is the number llm-stats.com shows, linked to OpenAI's launch post, with a note on how it was run: "Responses API harness with retained reasoning / compaction". ARC Prize tested the model itself on its Semi-Private set, with two harnesses (results page):
- With its Provider Adapter harness, which "preserves opaque reasoning state between requests and uses compaction", much as that note describes, the best result was 99.9%, at high reasoning; at max reasoning it scored 98.6%.
- With its Standard harness, where the model carries forward the notes it chooses to keep, the best result was 62.7%, at max reasoning.
So OpenAI's number held up in ARC Prize's own run, and the 37.2-point gap is the harness, not who ran the test. benchlm.ai lists the 62.7% as the model's ARC-AGI-3 score, and a Provider Adapter result of 98.55% as a separate benchmark row.
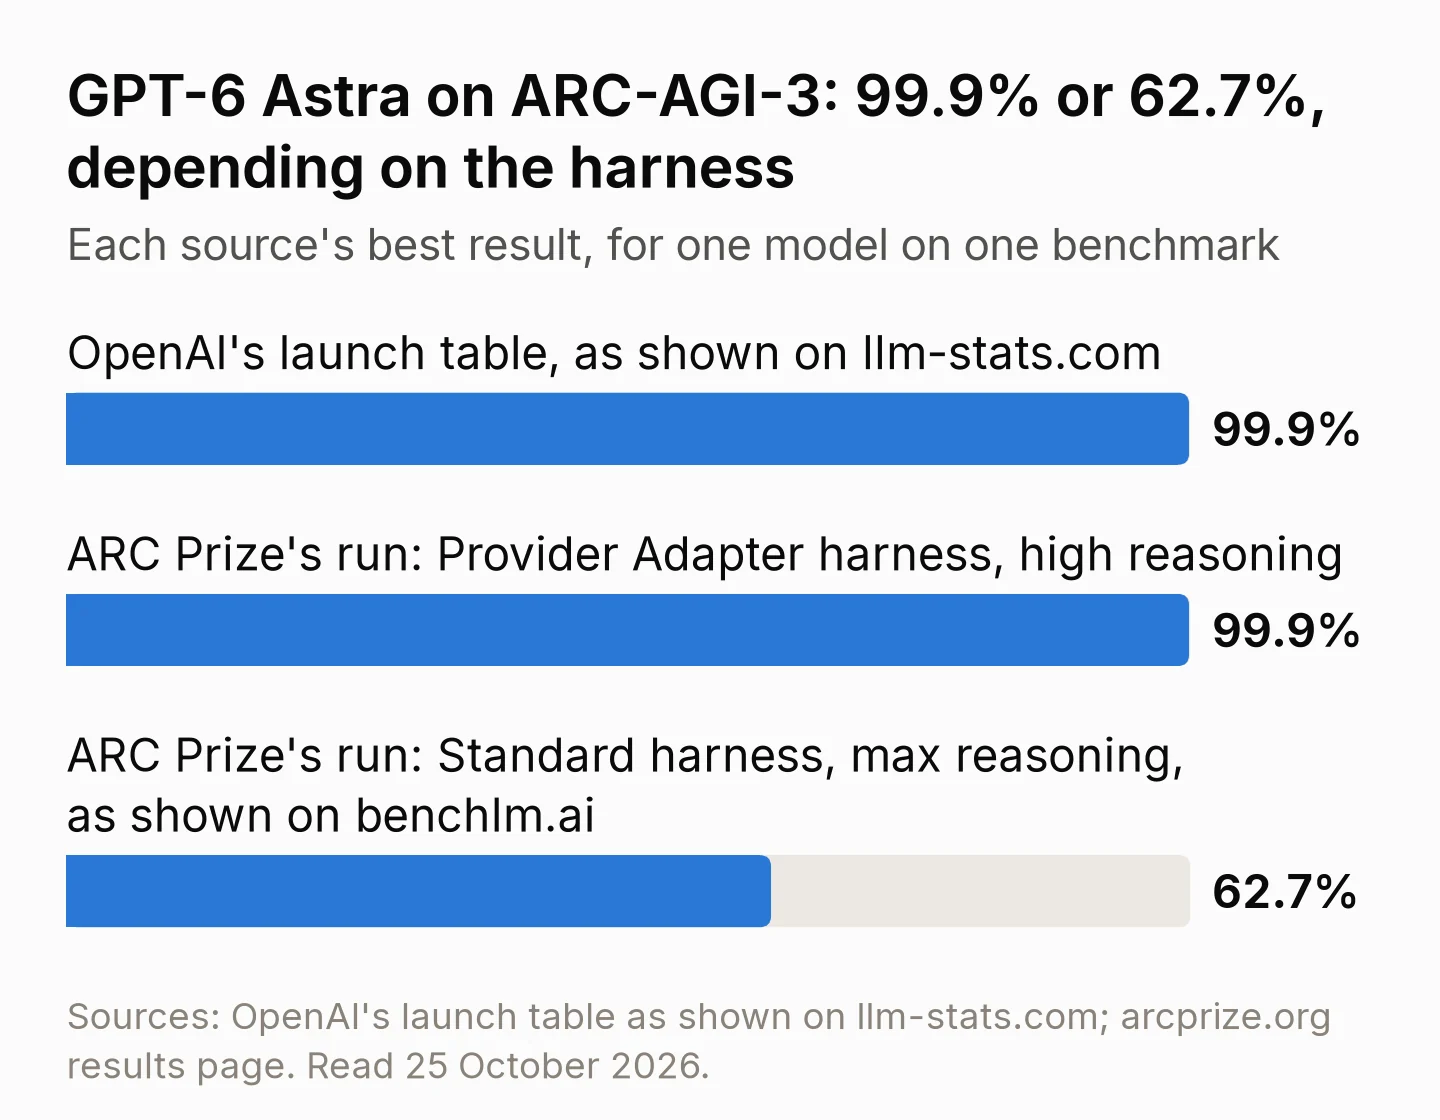
| Who ran it | Harness and setting | Score | Where it appears |
|---|---|---|---|
| OpenAI (launch table) | Responses API harness with retained reasoning / compaction | 99.9% | llm-stats.com |
| ARC Prize | Provider Adapter harness, high reasoning | 99.9% | ARC Prize's results page; benchlm.ai lists a Provider Adapter result of 98.55% separately |
| ARC Prize | Standard harness, max reasoning | 62.7% | ARC Prize's results page; benchlm.ai, as the model's ARC-AGI-3 score |
Both numbers are real, and they answer different questions: what the model does when its reasoning carries over from one step to the next, and what it does with the notes it chooses to keep. A list that shows one of them without its setting puts models side by side that took different tests. Both sites record the setting, to their credit: llm-stats.com keeps OpenAI's harness in the row's note, and benchlm.ai keeps the two harnesses as two benchmarks. The number a visitor compares is still the bare score.
Why do two leaderboards show different scores for the same model?
Because one benchmark name can hold different tests. In the pages we compared, 86 model-benchmark pairs appear on both sites. 76 agree within half a point. 10 differ, and in each case the two sites took a different variant of the result and filed it under the same name. Five of them can be quoted:
| Model and benchmark | llm-stats.com vs benchlm.ai | Why they differ |
|---|---|---|
| GPT-5.4 mini, Humanity's Last Exam | 28.2 vs 41.5, 13.3 points apart | without tools vs with tools |
| Claude Opus 5.5, OSWorld 2.0 | 81.8 vs 48.7, 33.1 points apart | a partial score from the announcement vs the system card's figure |
| DeepSeek R1 0528, SimpleQA | 92.3 vs 27.8, 64.5 points apart | a search-agent evaluation vs the plain model |
| DeepSeek R1 0528, SWE-bench Verified | 44.6 vs 57.6, 13.0 points apart | agent mode vs another setting |
| GPT-6 Astra, ARC-AGI-3 | 99.9 vs 62.7, 37.2 points apart | OpenAI's harness vs ARC Prize's Standard harness |
The other five are mismatches of unit or variant, such as a rating filed against a percentage, that we could not pin down well enough to quote. In the five above, both numbers are real and each site copied its number from a real source. The trouble is where the difference lives: in a note, while the comparison happens on the number.
How quickly do LLM leaderboards add new models?
An aggregator can only list a model once someone has published numbers for it, and then it has to find them. We took the named language-model releases in the ai-tldr.dev news feed from the 30 days to 25 October, 26 in all, and looked for each in both sites' sitemaps. llm-stats.com lists 12 of them (46%), benchlm.ai 15 (58%), and 16 (62%) are on at least one. Kimi K3.1 Pro, live in Moonshot's apps and API on 23 October, was in neither site's sitemap two days later.
Models that make pictures and video fare worse. Of five image and video models released in the same 30 days (FLUX 3 Image, FLUX 3 Image Klein, Krea 3, Qwen-Image-2.1-Turbo and Kandinsky 6.0 Video), neither site lists any. Of five voice and speech models, benchlm.ai lists four (Eleven v4, Grok Voice 3.0, Block's Dessa and Mistral's Voxtral 3) and llm-stats.com none.
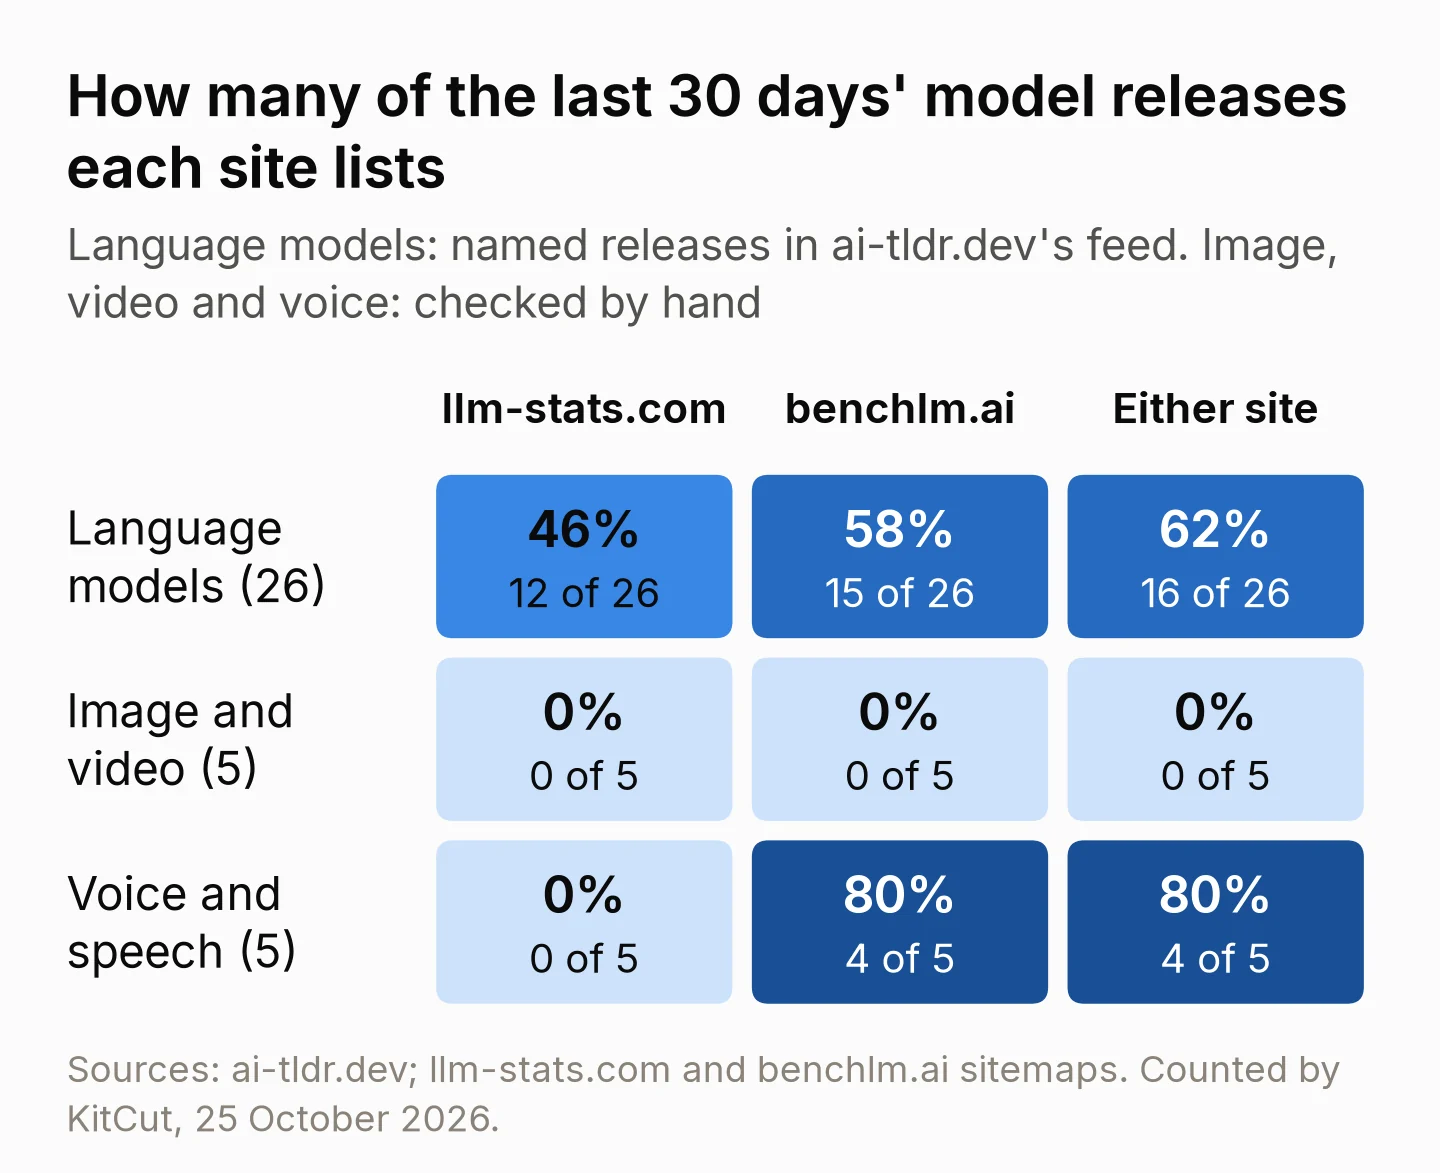
| Listed by | Language models (26) | Image and video (5) | Voice and speech (5) |
|---|---|---|---|
| llm-stats.com | 12 (46%) | 0 | 0 |
| benchlm.ai | 15 (58%) | 0 | 4 (80%) |
| Either site | 16 (62%) | 0 | 4 (80%) |
What both sites do well
Both sites do things every leaderboard should copy:
- A source link on every number. Every score we counted, on both sites, points to where it came from. That is what made it possible to trace 3,778 of them, and it is the habit everything else in this article builds on.
- llm-stats.com: breadth, and a note on every number. 584 model pages and 761 benchmark pages, a note on each number saying how it was measured, a model list on its data API that answers without a key, and a combined score in which "missing results remain missing and are never turned into synthetic losses".
- benchlm.ai: provenance, and the pages people need. A Supported or Estimated label on every ranked position, a registry of 764 benchmark definitions with their weights and successors, a deprecation calendar of 709 notices, pricing pages for each provider, a markdown copy of every page and open data files under CC BY-NC 4.0.
Are LLM leaderboards reliable?
As an index of what labs and evaluators have published, these two are careful and well sourced. As a measurement of which model is better, they inherit the settings of whoever ran each test, and one list sets numbers side by side that were not produced the same way. For an LLM benchmark comparison you can lean on, a leaderboard would do three things:
- Show who ran each number, and how, next to the number. 99.9%, OpenAI's harness with retained reasoning and 62.7%, ARC Prize's Standard harness are different facts. One stated setting per benchmark, printed beside the score, would have made each of the five disagreements above visible at a glance.
- Run a fixed test itself, on release day. The same tasks, the same harness and the same effort for every model, run the day it ships. One number produced the same way for every model is the one number neither site has. It would also give the cost of a finished task rather than a list price per million tokens, which matters because reasoning models spend very different numbers of tokens on the same job. Artificial Analysis already runs its index under identical conditions for every model, and shows a cost per task.
- Show its coverage. Which new models are missing, which positions are estimated and how many results each rank rests on. benchlm.ai already labels its estimated positions; that habit should spread.
Until then, four habits help:
- Click the source link of any score you plan to rely on, and read its footnotes.
- To compare models from different labs, prefer one evaluator's own runs under one stated setup, and read what that setup is.
- Check whether a rank is measured or estimated.
- Check the date. A model released this week may not be on the list yet.
What we are doing for image models
KitCut makes films with image models, so we need to know which one to use for which picture, and neither llm-stats.com nor benchlm.ai keeps up with them: of the five image and video models released in the last 30 days, neither lists any. So we have started doing the second of the three things above ourselves, for image models:
- Best AI image generator 2026: 8 models, the same 12 prompts, 96 pictures, every answer checked.
- How we test AI image models: the method, with Claude as the judge, written so that anyone can repeat it.
- GPT Image 2.5 Sunburst vs Flare: two versions of one model on the same 12 prompts, side by side.
It is a start, not a leaderboard: one fixed set of prompts, run by us on every model, with the pictures on the page. We compared language models for our own work the same way, with the same films made by Claude Opus, Claude Sonnet and GPT and graded blind (the cheaper model wasn't half the price).
How we counted
Updated 25 October 2026. Every count was made that day, from the two sites' own pages and data files.
- llm-stats.com, 1,222 scores: the statistics block on each of 15 major benchmark pages (total results, verified, self-reported). We also read the 241 score rows embedded in the pages of 16 models from the top of its leaderboard, and counted the 2,224 rows of its open data repository on a copy.
- benchlm.ai, 2,556 scores: the source named on every benchmark row of its 60 highest-ranked models' pages, grouped by source. The 224 ranked positions, 137 of them Estimated, are from its leaderboard.
- Both sites: 86 model-benchmark pairs from the pages we read appear on both. "Agree" means within half a point.
- Coverage: the 26 named language-model releases in the ai-tldr.dev feed over the 30 days to 25 October, looked up in each site's sitemap. Image, video and voice releases were checked by hand.
- GPT-6 Astra: OpenAI's figure as shown on llm-stats.com, ARC Prize's figures from its results page, and benchlm.ai's from its model page.
- Traffic: Similarweb's estimates for September 2026, worldwide (llm-stats.com: 1,216,000 visits; benchlm.ai: 1,242,000).
The limits:
- It is a snapshot. Both sites update daily, and any count here may have moved since.
- Name matching is approximate. One model goes by many spellings and effort levels, so read the coverage shares as plus or minus 10 points.
- It is a sample: 15 major benchmarks out of 761 benchmark pages on llm-stats.com, and the top 60 of benchlm.ai's ranked models. The rest of each catalogue may mix differently.
- Similarweb's visit counts are modelled estimates, not the sites' own analytics.
If either site finds a mistake in these counts, write to [email protected] and we will correct it here.
FAQ
Are LLM leaderboards reliable?
They are reliable as an index of published results when every number links to its source, as on llm-stats.com and benchlm.ai. They are less reliable as a measurement, because different people produced the numbers with different settings. Of the 3,778 scores we traced on those two sites, none came from a test the leaderboard ran. Check who ran a number, and how, before you rely on it.
What does self-reported benchmark mean?
It means the company that made the model ran the benchmark itself and published the score, usually in a system card, launch post, paper or model card. The number is not necessarily wrong, but the company chose the harness, the reasoning effort, the tools and the number of attempts. On llm-stats.com, 99.3% of the results on its 15 major benchmark pages are flagged self-reported.
Which LLM leaderboard runs its own tests?
Neither of the two we counted: llm-stats.com and benchlm.ai collect numbers that others published. Arena leaderboards collect people's votes between two models' answers, which measures preference rather than a fixed test. Evaluators such as Artificial Analysis, ARC Prize, Epoch AI and Vals AI publish results of runs they did themselves, and benchlm.ai takes 45.9% of the rows on its top 60 model pages from evaluators like these.
Why do two leaderboards show different scores for the same model?
Usually because they copied different variants of one result: with or without tools, a partial score or the system card's, a search agent or the plain model, the lab's harness or an evaluator's. Of 86 model-benchmark pairs we found on both llm-stats.com and benchlm.ai, 10 differ; the five we can quote differ by 13 to 64.5 points. GPT-6 Astra on ARC-AGI-3 is 99.9% on one site and 62.7% on the other, and ARC Prize measured both, with two harnesses.
How can I check a benchmark score myself?
Follow the source link to the page the number came from, and read its footnotes for the harness, the reasoning effort and the tools. Then look for an independent run of the same benchmark: ARC Prize, for example, publishes a model's results with the harness and reasoning level beside each score. In all ten disagreements we found between the two sites, the reason was a different variant, setting or unit.
KitCut makes explainer films on the same principle: every number on screen comes from a fact sheet and has its source named (why an explainer needs code).